01Five steps
From idea to verdict in five steps, each on published research
The Nexus overview shows research under controls as five steps. Here is each one: what Nexus does, the research it rests on, and whether it runs today.
-
1
Trial counted
Before any data is read
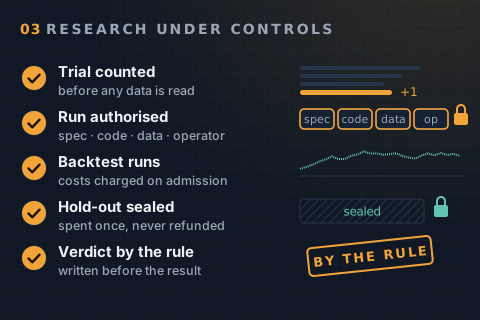
Every trial is booked in an append-only register before the first market-data read. The research pipeline's stages, batch calibration, strategy-builder long tests and promotion each check the booking again, so a run that was never booked, or is larger than its booking, is refused. Bookings made after the fact still count. The number of trials in a family sets the bar in step 5.
One exception is open. Re-pricing a live book at newly measured costs creates a re-costed copy without a booking. Whether that copy counts as a new trial is awaiting a ruling.
ResearchTry enough variants and the best one looks good by luck alone: the expected best Sharpe ratio of N strategies with no edge rises with N. Bailey, Borwein, López de Prado and Zhu (2014); Bailey and López de Prado (2014).
RunsAt those four entry points. Re-pricing a book at new costs does not book a trial yet.
-
2
Run authorised
Spec, code, data, operator
A counted run needs a one-shot authorisation that binds the specification's hash, the code commit, the data IDs, a review document and the operator's own sentence. It is root-owned, so no agent can write it.
WhyThis is governance rather than statistics. It makes the trial counted in step 1 the one that actually ran.
RunsFor every counted run except exploratory sweeps.
-
3
Backtest runs
Out of sample, with leakage removed
The out-of-sample record a calibration reports comes from walk-forward analysis. Parameters are chosen on a training block and tested on the block that follows. The window then rolls forward, and the test blocks are chained into one record. Walk-forward efficiency, the out-of-sample score over the in-sample score, is reported for every run.
One limit: the parameters a calibration stores for later use are not chosen by this train-then-test loop. They come from a separate rolling ranking that scores fixed configurations on its test blocks, with a correction for the number tried, and the walk-forward search starts from that winner.
Training rows whose outcome overlaps the test block are purged, and one trading session is embargoed at the boundary. Both are counted in sessions, so weekends and holidays are handled. A fold left too thin is refused, not relaxed.
ResearchWalk-forward analysis and its efficiency ratio: Pardo (1992, 2008). Purging and embargo: López de Prado (2018), chapter 7.
RunsOn every batch calibration, as the reported record; the stored parameters come from the separate ranking. The efficiency gate fails only a negative ratio; Pardo's 0.5 rule of thumb is not a gate.
-
4
Hold-out sealed
Spent once, never refunded
On the newer research path, a fixed three-year slice, September 2023 to August 2026, is sealed. A read through the governed route needs a break-seal token. The token spends one of two looks shared across the path's campaigns before the first sealed read, with no refund if the run then fails. A read without a token is logged and warned about, not blocked. A sealed result must clear a one-trial bar: a probabilistic Sharpe ratio above 95 % and a minimum Sharpe ratio.
ResearchProbabilistic Sharpe ratio: Bailey and López de Prado (2012). A hold-out stops being out of sample once a result has been tuned against it, so each look is spent, not borrowed.
BuiltNo look has been spent yet. A read without a token warns rather than refuses. On the trend path the latest stretch of history is held back as a reference score, but it is not sealed.
-
5
Verdict by the rule
Written before the result
Each campaign writes its accept rule before any result exists, and closes on that rule. The survivor rule for a selected candidate is the exact familywise 5 % test, assuming independent strategies with normally distributed Sharpe ratios. Its out-of-sample Sharpe ratio must clear the 95th percentile of the best of N strategies with no edge, where N is the counted family from step 1, so more trials raise the bar. Three reversion campaigns closed negative on their rules in September 2026, with the sealed years left unread.
ResearchFamilywise error control: Bonferroni, in Šidák's (1967) exact form. Why a new result needs a t-statistic nearer 3 than 2: Harvey, Liu and Zhu (2016).
Rule in codeAt the research pipeline's survivor gate. No pipeline run has used it yet.
02Guards
Guards that run on every change
Some failures do not show up as a bad result. They show up as a good one. These checks run before code reaches production, not after a result looks suspicious.
- Random-walk canary Runs
Statistically powered tests feed the full search random-walk prices, which have no edge to find, and assert that the best result scores about zero. They run in CI and in the pre-deploy gate, and a non-zero score breaks the build. Look-ahead adds edge that a correction for the number of trials cannot remove, so it needs a guard of its own.
- Look-ahead tests Runs
Dedicated tests check that no future data reaches a signal, and that delaying a fill manufactures no edge on random prices.
- Bad data stops the run Runs
A dataset that fails its quality checks or has gone stale is refused at the start of a test and again at promotion. A nightly replay that hits a failed upstream fetch publishes nothing, and the next night retries.
- Sharpe never alone Runs
In the strategy report every Sharpe ratio sits beside its standard error and the bars and years behind it, so a short record cannot pass as a strong one (Lo 2002).
03Costs
Costs measured, not assumed
Cost is where most backtests flatter themselves. Nexus charges what the broker charges, refuses to guess, and says where it still approximates.
- Measured per leg
Books that trade pay each leg's measured broker spread, half on each side, and overnight funding by asset class. A leg with no usable measurement is refused by name and never priced at a default.
- Broker minimums
The broker's minimum trade size for each market is checked when a book is frozen and again before promotion, so a book that cannot be placed at its design capital does not reach the trader.
- Cost by year and hour
On the newer research path, cost is resolved by year and by time of day. Older years are estimates: a per-year spread census from a market-data vendor is converted to the broker's terms by a ratio measured today, and a market with no broker measurement of its own is marked as estimated. A year with no census is never given a modern default. The cost tables are pinned by content hash, re-checked on every build, and every test also runs at 1.5 times cost. This path is separate from how trading books and the calibration search are priced.
- Costs at admission
On the target-position engine that runs panel strategies, a position is opened or added to only if its forecast clears its own uncertainty plus a round-trip cost reserve. Trend books and the calibration search do not apply this hurdle.
- No-trade band
Small changes in the target position are held inside a band, so the book does not pay to chase noise. Under proportional costs the optimal policy has exactly such a no-trade region (Constantinides 1986; Davis and Norman 1990). Nexus sets the band's width; it does not derive it.
- Break-even
Each trading book reports, nightly, the multiple of its cost that would erase its edge.
Where it still approximatesTrading books charge today's measured spread across their whole history, and their report flags it. The calibration search charges a flat cost per trade; measured per-leg costs apply to the books that trade. On the newer research path, older years' costs are estimates scaled by today's broker ratio.
04Robustness
Robustness, before and after capital
A result that survives selection is then watched. Every active book is replayed each night and judged by rules written before it started.
- Forward replay. Every active book is replayed nightly at its frozen parameters. Its pre-registered review rules return PASS, KILL, INCONCLUSIVE or PENDING, and a KILL blocks promotion. PENDING, for a book with too few days, is advisory.
- Rolling performance. Rolling 21, 63 and 126-bar Sortino ratio and drawdown, with average drawdown and time under water.
- Bootstrap bands. Block-bootstrap bands at the 5th, 50th and 95th percentiles for Sortino ratio and drawdown, nightly. A diagnostic, not a gate (Künsch 1989).
- Paired comparison. In counted single-change trials, a candidate is scored against its control on the same data with a paired block bootstrap, and accepted only if it is no worse within a margin stated in advance. It is not a general acceptance gate: the broader Sharpe-uplift gate is built but not in use.
- Leave one out. Each sleeve is removed from the book in turn, to show how much of the result depends on it.
- Turnover. Annualised turnover is measured on every run and reported per configuration, per out-of-sample record and per leg.
05Plug in
How a quant plugs in
A strategy is a document of named slots, and your model fills the forecast slot. Bringing a model in is integration work through the strategy builder's extension points. It runs on an engine that already exists, under every control on this page.
- 1
Preview
Score the strategy on the one declared window for its clock. Warm-up history is loaded but never scored, and every look is logged before any data is read.
- 2
Compose and save
Change a stored strategy's settings within versioned, bounded menus, and save it under a name that is never reused.
- 3
Long test
Submit the document. The trial is booked in the register first. The job then queues with an at-most runtime and memory quote, and runs to a report.
Results are governed
What you can see is part of what gets counted.
- Results show only inside a booked session, capped at 24 distinct strategies.
- Every result shown is listed, so a later counted booking charges it.
- The look log fails closed: if it is down, nothing is shown.
One report, one API
The same sections whichever engine ran.
- Gross and net P&L with the cost between them, Sharpe beside its standard error, turnover, drawdown and hit ratio, and forecast rank IC for panels.
- API first: typed FastAPI services, with the console's types generated from the API schema.
For a quantKeep the model in one component and the framework handles the rest: clean data, sizing, costs, counted trials and honest statistics. The two ways in, a forecast for a trend book or for a cross-sectional panel, are in the case study.
06Stated plainly
What runs, stated plainly
Each control is graded against the code, and the grade is shown here. Naming what is not built yet is part of the method.
Runs today
- Purging and embargo on every walk-forward fold and on the hold-out.
- Walk-forward analysis with its efficiency ratio, as the reported out-of-sample record.
- Counted trials at every research entry point (re-pricing a book at new costs is not booked yet), and one-shot run authorisation.
- The random-walk canary and the look-ahead tests.
- Measured per-leg costs and broker minimums on trading books.
- Nightly forward replay, with KILL rules that block promotion.
Reported, not a gate
- Deflated and probabilistic Sharpe ratios (Bailey and López de Prado 2012, 2014).
- Minimum backtest length for the number of trials (Bailey, Borwein, López de Prado and Zhu 2014).
- Bootstrap bands for Sortino ratio and drawdown.
Built, not yet in use
- The familywise survivor rule. No research-pipeline run has used it yet.
- The sealed hold-out. No look has been spent, and a read without a token is warned about, not blocked.
- Combinatorial purged cross-validation with the probability of backtest overfitting (López de Prado 2018; Bailey, Borwein, López de Prado and Zhu 2017), and a measured effective number of trials. Both need a daily NAV and cash series that nothing produces yet.
Not built
- Bootstrap tests of the best of many rules (White 2000; Hansen 2005; Romano and Wolf 2005).
- False-discovery-rate control (Benjamini and Yekutieli 2001).
- The haircut Sharpe ratio (Harvey and Liu 2015).
- This page describes the framework. It shows no strategy returns and makes no performance claim.
- Grades come from an audit of the code and move as the code does. A grade is raised only when the code behind it is re-read.
Sources, read 2026-10-15: the research service's implemented-methods checklist, refreshed that day by an audit of its code as of 14 October with an adversarial re-check of every change of grade; its method catalogue and verified references; and an audit of the strategy builder for the interface section.
07Reading list
The reading list
Every work cited on this page.
Validation and leakage
- Pardo, R. (1992). Design, Testing, and Optimization of Trading Systems. Wiley.
- Pardo, R. (2008). The Evaluation and Optimization of Trading Strategies, 2nd ed. Wiley.
- López de Prado, M. (2018). Advances in Financial Machine Learning. Wiley.
Overfitting and significance
- Bailey, D. H. and López de Prado, M. (2012). The Sharpe ratio efficient frontier. Journal of Risk.
- Bailey, D. H. and López de Prado, M. (2014). The deflated Sharpe ratio. Journal of Portfolio Management.
- Bailey, D. H., Borwein, J., López de Prado, M. and Zhu, Q. J. (2014). Pseudo-mathematics and financial charlatanism. Notices of the American Mathematical Society.
- Bailey, D. H., Borwein, J., López de Prado, M. and Zhu, Q. J. (2017). The probability of backtest overfitting. Journal of Computational Finance.
- Lo, A. W. (2002). The statistics of Sharpe ratios. Financial Analysts Journal.
- Šidák, Z. (1967). Rectangular confidence regions for the means of multivariate normal distributions. Journal of the American Statistical Association.
- Harvey, C. R. and Liu, Y. (2015). Backtesting. Journal of Portfolio Management.
- Harvey, C. R., Liu, Y. and Zhu, H. (2016). … and the cross-section of expected returns. Review of Financial Studies.
- White, H. (2000). A reality check for data snooping. Econometrica.
- Hansen, P. R. (2005). A test for superior predictive ability. Journal of Business and Economic Statistics.
- Romano, J. P. and Wolf, M. (2005). Stepwise multiple testing as formalized data snooping. Econometrica.
- Benjamini, Y. and Yekutieli, D. (2001). The control of the false discovery rate in multiple testing under dependency. Annals of Statistics.
Robustness and resampling
- Künsch, H. R. (1989). The jackknife and the bootstrap for general stationary observations. Annals of Statistics.
Trading costs
- Constantinides, G. M. (1986). Capital market equilibrium with transaction costs. Journal of Political Economy.
- Davis, M. H. A. and Norman, A. R. (1990). Portfolio selection with transaction costs. Mathematics of Operations Research.