01Universe
Ten sources, nine asset classes, one store
A mid-frequency system needs long daily history to test across many market conditions, and dense intraday bars to measure entries, exits and costs. Nexus holds both in one time-series store, so research, the simulator and the trader read from the same place.
| Source | What it supplies | Coverage | From | Resolution |
|---|---|---|---|---|
| Databento | Exchange futures from CME Globex and ICE US softs: the front and next contract for each market, every individual contract, and settlement, volume and open interest | 40 markets · 3,982 contracts | Jun 2010 (softs Dec 2018) | Hourly and daily; 1-minute for five index markets, Nov 2015 to Aug 2023 |
| Pinnacle Data CLC | Back-adjusted continuous futures, as the vendor builds them | 39 markets | Jan 1969 | Daily, to Jul 2026 |
| IG (live capture) | The broker's own bid, offer and mid for the markets the book trades, and more | 64 markets | Jul 2026 | 1-second and 1-minute; 5, 15 and 60-minute derived |
| Dukascopy | FX, commodity, index and rate prices, bid, ask and mid | 36 instruments | May 2003 | 1-minute |
| Cboe | The VIX family and individual VX futures contracts | 3 indices · 270 contracts | Jan 2004 | Daily |
| Yahoo Finance | Equities, ETFs, futures, FX and indices | 6,038 equities · 199 ETFs | Jan 1999 | Daily; hourly from Apr 2024; 5 and 15-minute from Feb 2026 |
| CCXT | Crypto pairs from exchange APIs | 535 pairs | Aug 2017 | Daily and hourly; 15-minute from 2020; 5-minute from 2023 |
| FRED | Interest rates, inflation, credit spreads and spot energy | 42 series | Jan 2000 | Mainly daily |
| STOXX, HSI | European and Hong Kong volatility indices | 1 each | 2016, 2026 | Daily |
Tickers by asset class
11,176 tickers with stored bars, each counted once by its class in the instrument reference.
- 6,038Equities
- 4,029Futures
- 535Crypto
- 273Volatility
- 199ETFs
- 46Indices
- 36Rates
- 16FX
- 4Spot commodities
Futures: 40 markets with exchange data, by sector agriculturals 13, FX 7, equity indices 5, rates 5, energy 5 and metals 5. 47 exchange calendars and 47 futures roll calendars.
Bars held, by resolution
Catalog estimates. Bid, mid and offer are counted separately.
1-second≈391M
1-minute≈636M
5-minute≈77M
15-minute≈29M
Hourly≈36M
Daily≈21M
TimescaleDB, 93 GB on disk. Chunks compress after seven days, 10.4 times overall and 13.2 times for 1-second bars. No price table has a retention policy, so nothing is aged out.
What can be tradedExecution today is through one broker, IG, on a demo account. Of its 64 captured markets, 37 are enabled for the live book and 27 are captured for research only. Everything else on this page is research data.
02Futures
From expiring contracts to one continuous series
A trend book needs long, unbroken futures histories, but a futures contract expires every month or quarter. A continuous series joins the contracts together. Each choice in that join changes the backtest: which contract, when to switch, and how to close the price gap at the switch. Here is each choice Nexus makes.
-
1
Which contract
Front and next, hour by hour
For each of 40 markets the exchange feed supplies two hourly series: the front contract and the contract after it. It also supplies every individual contract daily, 3,982 of them since 2010. The front contract is chosen by the vendor's published rule, not by hand.
RunsHourly and daily, for all 40 markets.
-
2
When to switch
Volume for most, the calendar for rates
35 markets switch when the next contract trades more volume than the front. The five rates markets, four Treasury futures and three-month SOFR, switch on the calendar, the day after the front contract's last trade. In September 2026 the 10-year Treasury last traded on the 21st and switched on the 22nd. The E-mini S&P 500 switched on volume on the 16th, two days before its last trade.
Nexus also keeps its own roll calendar for 47 markets: 8,564 contracts from 1999 to 2031, each rolled five business days before its last trade. For Treasuries the calendar rolls five business days before an approximate first-notice date instead. It decides which contract the term-structure inputs use. It does not set the continuous price series.
RunsThe vendor's rule sets the price series. The house calendar skips weekends but not holidays.
-
3
How to close the gap
Ratio back-adjustment
At a switch the next contract usually trades at a different price from the front, and that gap is not a return anyone earned. Nexus removes it by scaling older history by the ratio of the two prices at the switch, as the next section shows.
RunsOn all 40 exchange markets.
-
4
Where the live book stands
The broker's contracts
The book trades the broker's contracts, not the exchange's. The broker's undated contracts never expire. Its dated ones, such as the Treasury contracts, move to the next contract around the last dealing date. When they do, the live series is re-anchored so the switch adds no return (section 06).
RunsOn the broker demo account.
03Back-adjustment
Ratio by default, difference where it fits
No way of joining contracts is neutral. Each method keeps one property and gives up another. Nexus picks a method per source, records it on every dataset, and checks that the result still agrees with the raw prices.
| Method | Keeps | Gives up | In Nexus |
|---|---|---|---|
| Ratio, backward | Percentage returns across each roll | Point-value moves in older years. It cannot span a negative price, and its fallback at a missing quote can misplace one bar's move. | Default All 40 exchange markets, hourly and daily, from 2010. The trend book and its simulation read it through the broker-blended series. |
| Difference, backward | Price changes in points | Percentage returns. Older prices can drift below zero. | Held The 39-market daily history from 1969, analysed as price differences, not returns. Used directly for one index market that has no exchange feed. |
| None (raw splice) | The prices that actually traded | Every roll shows as a jump that nobody earned | Kept Front and next contract, raw, for all 40 markets: the input to the adjusted series and its check. |
| Held contract with roll trades | The exact profit and loss of the contracts held, roll trades included | Needs contract specifications and an accounting reference for each contract | Not built Parked in October 2026. |
- The ratio
A roll is wherever the front contract changes. The ratio is the next contract's close over the front contract's close on the last bar before the switch, and all earlier history is scaled by the product of the ratios after it. Where the next contract has no price at that bar, the ratio falls back to the new front contract's first price over the old one's last. Those prices come from different bars, so the market's move between them is folded into the adjustment instead of kept as a return. A ratio outside 0.5 to 2 is flagged, and one outside 0.1 to 10 is not applied.
- Negative prices
US crude oil settled at −$37.63 on 20 April 2020. A ratio cannot span a change of sign, so negative bars are left out of the ratio-adjusted series, counted and warned about rather than dropped in silence. A difference-adjusted variant for those markets is not built.
- New data, old history
Each new window of exchange data is adjusted on its own, then scaled to the stored series at the latest bar both share. A new roll therefore never rewrites history. A join that moves more than 0.15 in log terms is refused and alerted, never written. Between full rebuilds, recent adjusted prices drift away from the traded contract price, while returns are unaffected.
- Adjustments on record
Each market's dataset records the adjustment events found in its history, each with the time it takes effect and its ratio: 4,229 across 40 markets. They are detected afterwards from the steps between the adjusted and raw series, and refreshed in batches. Only 71 name the two contracts. A very small adjustment can fall below the detector's tolerance, and the recorded time is when the adjustment applies, not necessarily the vendor's roll date. They are not a complete roll ledger.
- Checked against raw
The data checks compare adjusted with raw. Three can fail a series: the latest adjusted level must anchor to the raw price, the adjustment must not crush the size of price moves, and the declared method must suit the data. Two more only warn: roll returns well beyond the market's own, and long-run drift between adjusted and raw. Details are in Validate and clean.
- Roll cost
The adjusted series removes the gap but not the cost of rolling. On markets traded through dated contracts, the simulation charges a smoothed roll cost of four spreads a year.
For a trend bookA trend book sizes positions from percentage returns and their volatility. Ratio adjustment keeps those true across a roll where both contracts are quoted at the switch, which is why it is the default. Point-value history is still there in the raw contracts kept beside it.
04Series kept
Every series side by side, none overwritten
Nexus keeps the raw and the derived together. Each dataset is tagged with its source, how it was built, its roll method and rule, its calendar, its time zone and how its prices are quoted. Any adjusted price can be traced back to what the vendor delivered.
| Series | What it holds | Held | How it changes |
|---|---|---|---|
| Vendor archive | Paid downloads as received, with checksums | every download since Oct 2026 | Write once. A series can be rebuilt from the archive; earlier downloads cannot be replayed. |
| Individual contracts | Each futures contract on its own, daily | 3,982 contracts · 1.13M bars | Insert-only |
| Front contract, raw | The front contract, joined at each roll, unadjusted | 40 markets · 3.05M hourly bars | Insert-only |
| Next contract, raw | The contract after the front, unadjusted | 40 markets · 2.43M hourly bars | Insert-only |
| Ratio-adjusted continuous | The front contract, ratio back-adjusted (section 03) | 40 markets · 3.04M hourly, 178K daily | Appended without rewriting; rebuilt only by a full reload |
| Difference-adjusted history | The vendor's own back-adjusted continuous series | 39 markets · 432K daily bars from 1969 | Held as delivered |
| Broker-blended continuous | Exchange history with the broker's live prices after it (section 06) | 36 markets · 2.78M hourly bars | Rebuilt every hour inside a window of at most 14 days. Before the join it is a byte-for-byte copy of the exchange series. |
| Live broker capture | Bid, offer and mid, as 1-second and 1-minute bars | from Jul 2026 | Each bar written once (section 05) |
| Contract observations | Settlement, volume and open interest for each contract | 40 markets · 33.9K rows from Dec 2025 | Append-only, enforced in the database. Each row carries three timestamps, a content hash and a revision number. |
And the clean layerThe cleaning engine does not edit these series. A clean copy is rebuilt from raw plus a log of operations, and every operation can be undone. That is step 2, Validate and clean.
05Live capture
Broker ticks, stamped on arrival and written once
The broker is both a data source and the venue. Capturing its own prices means the live book and its record see exactly what the broker quoted.
- Stamped on arrival Runs
Every tick is stamped with Nexus's own UTC receipt time, because the broker's update time has no date. Bid, offer and mid are all kept.
- Written once Runs
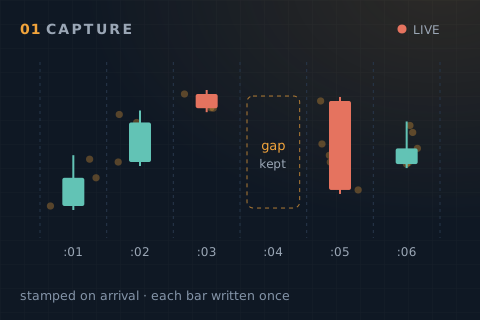
A bar holds only the ticks inside its own interval and is finalised once. A tick that arrives late is dropped, never applied to a closed bar. 1-second and 1-minute bars go to the time-series store. A 1-second quote cache serves the trader, but it is not the record.
- Gaps stay gaps Runs
A second or a minute with no ticks stays empty, and no bar is ever made up. Each weekday night, gaps of 30 minutes or more from the last 14 days are fetched again from the broker's own price history. Which minutes should exist is learned from each market's last four weeks: a minute is expected if it appeared in at least 60 % of them. The refetch stays inside a fixed share of the broker's weekly data allowance.
- Derived bars Runs
5, 15 and 60-minute bars are rebuilt from the 1-minute bars every ten minutes. Only fully elapsed buckets are written, so a half-formed hour never reaches research.
- Watchdogs Runs
The capture reconnects and alerts after 120 seconds without a connection, and after 300 seconds with no finished 1-minute bar while a market is open. A subscription that falls silent is renewed every 180 seconds, up to twice, before its connection is rebuilt, at most six times an hour. A sweep each morning pages operations about any hour with minute bars but no hourly bar. At 12:34 UTC on 15 October, 88 of 91 subscriptions were receiving.
Under the hoodThe broker's streaming protocol, and why a connection can report healthy while writing nothing, are in Three ways to stream.
06History meets live
History and the live tail, joined at a seam you can inspect
Exchange history arrives twice a day, hours after the close, while the broker's prices arrive every second. Simulation needs the long history and a live book needs the latest hour. Nexus joins the two into one series, and simulation and the live book both read it.
-
1
A byte copy up to the handoff
Up to the last completed bar that both sources share, the blended series is an exact copy of the ratio-adjusted exchange series. The build checks that this prefix matches byte for byte, so the history a strategy is tested on is the exchange's.
RunsRebuilt hourly, with a full recompute every night as a check.
-
2
Broker returns after it
From the handoff on, the broker's mid-price returns are chained onto the last exchange level, with open, high and low scaled by the same factor. The handoff moves on every hourly run, so each exchange delivery replaces the broker's prices with the exchange's. Exchange data lands twice a day, about 14 hours after the bar at the median, so the broker tail is typically 4 to 13 hours long.
On dated broker contracts the broker and exchange prices differ by about zero. On the broker's undated contracts the gap is the funding rate. Outside grains, softs and energy, the error at the join is within 3.4 basis points.
RunsFor 36 markets.
-
3
Broker rolls add no return
When the broker moves a dated contract to the next month, its price steps by the calendar spread. Nobody made or lost that money. At the 27 August 2026 rates roll this step would have put four false returns, of 0.06 % to 0.38 %, into the series the live book trades from, each far too small for an outlier check to catch. The series is re-anchored at every broker roll so the seam return is exactly zero.
RunsThe bar at the seam loses its true move along with the false one.
-
4
Unexplained steps are refused
A first broker-tail return beyond 0.05 in log terms, about 5 %, is refused, not written. A market refused six runs in a row is reported stale. The tail's age raises a warning at 36 hours of open market, not 36 hours of clock time, so a weekend is not an alarm.
RunsA refused market is not updated on that run, and the refusal is logged.
Same series, same code
Simulation and the live book cannot disagree about the data.
- One series. The trend book's simulation and the live book both read the broker-blended series, through the same sizing engine at the same pinned version.
- Completed bars only. A bar can be used only once it has closed by the decision time. The engine takes the latest closed bar within each market's maximum age, and has no forward-looking or nearest-bar mode.
- Checked daily. Each trading day the live book is built under two cut-off rules and both sets of weights are stored, so any difference shows.
- Stamped at read. Each simulation records which series it read when it read it. The trader and the simulation once read different series for 13 days in August 2026, and this stamp is the fix.
Walking forward
How new data reaches research.
- Nightly replay. Every active book is replayed each night at its frozen parameters, so its out-of-sample record grows by one day at a time.
- Cut-off by bar time. Research reads up to a cut-off on the bar's own timestamp, not on when the data arrived. Vendor revisions and delivery delays are therefore not replayed.
- Delays measured. On 3 October 2026 the exchange series arrived a median 13.6 hours after the bar (95th percentile 19.6 hours), and the broker's in about one hour.
For your firmA strategy is tested on exchange history and traded on the broker's prices, and the join between them is a rule you can read. The seam, its guards and its known limits are all on record.
07Stated plainly
What runs, stated plainly
Naming what is not built yet, and what is still being checked, is part of the method.
Runs today
- Ratio back-adjustment on all 40 exchange markets, with implausible ratios flagged or refused and new data appended without rewriting history.
- Broker capture at one second, stamped on arrival, each bar written once, with gaps kept as gaps and refetched overnight from the broker.
- The broker-blended series: a byte copy up to the handoff, zero-return broker rolls and refused unexplained steps.
- One series and one engine for simulation and the live book, using completed bars only.
Runs, with limits
- Roll records are adjustment events detected after the fact and refreshed in batches. Most do not name their contracts, and they are not a complete roll ledger.
- Recent adjusted prices drift from the traded price between full rebuilds. Returns are unaffected.
- Negative prices are left out of the ratio series.
- The next-contract series does not always hold the next contract.
- Research reads by bar time, not by arrival time.
- The store's coverage summary for broker and minute feeds has not refreshed since 24 September. The bars themselves are current.
Being checked
- Rates roll months. The rates markets hold 25 % to 75 % fewer hourly bars in each quarterly roll month. The cause is being investigated.
- Soft commodities. Their exchange series were found to miss most trading hours. A rebuild from the archived downloads is staged.
- Exchange minute bars stop in August 2023. The 1969 difference-adjusted history is not yet joined to the exchange series.
Not built
- Held-contract profit and loss with recorded roll trades. Parked in October 2026.
- A history of contract specifications. The table exists and is empty.
- Point-in-time versions of adjusted price history.
- A difference-adjusted series for markets that have printed negative prices.
- An exchange futures broker for execution.
- This page describes the data platform. It shows no strategy returns and makes no performance claim.
- Figures move as data lands; each is dated to the day it was read.
Sources, read 2026-10-15: TimescaleDB catalog estimates and compression statistics; the store's coverage cache; the dataset, roll-calendar, contract and calendar reference tables; the logged cleaning and roll records; the data service's fetch, adjustment and splice code on its main branch; the capture service's status; and the work board for the open investigations.