The book
Which model version and parameters produced the target? When did that target change, and what quantity did the broker actually hold? A target weight, a rounded order and a held lot are different records.
Nexus engineering · Deep dives
When a broker account differs from the simulation it follows, “slippage” is too broad an answer. The useful question is which book, event or valuation explains the difference—and what evidence is still missing.
Source and published evidence reviewed 2 November 2026. Historical observations are dated below.
01 · Define what is being compared
A simulation and a broker account can disagree even when they follow the same strategy. The first job is to make their economic meaning comparable. Nexus reconstructs intermediate books so the gap can be inspected one boundary at a time.
Which model version and parameters produced the target? When did that target change, and what quantity did the broker actually hold? A target weight, a rounded order and a held lot are different records.
The bridge uses hourly closes and days ending at 21:00 UTC. A bar stamped at the start of an hour only becomes available at its close. Each market’s observation time is converted from Chicago wall time, including daylight saving.
Model-feed prices and broker mid-prices answer different questions. The account leg removes classified capital flows from the NAV change; measured financing is retained and shown separately.
02 · Follow the accounting
Account − simulation ledger
= − simulation accounting + target drift + implementation + price basis + spread + financing + residual
The labels describe differences between reconstructed series. Selecting a term explains its construction and the evidence needed before assigning a cause. There are no illustrative returns in this explorer.
simulation ledger − served targets. The ledger uses the engine’s bar accounting and modelled costs; the served book is repriced on the bridge’s common clock. This term enters the bridge with a minus sign.
Inspect observation-day alignment, Sunday and missing-price bars, nearest-bar choices and cost conventions. A timing difference should be identified before it is called poor execution.
trader targets − served targets. Both are valued on the model feed, but each switches weights when its own process does.
Inspect the recorded model version, parameters, availability time and planner fire. A different target can be a deliberate book change or an operational mismatch; the arithmetic alone does not choose between them.
held / model feed − trader targets. The actual lot position is compared with the intended weight, using model-implied broker prices anchored at recorded events.
Lot rounding, closed markets, execution timing and the equity basis can contribute. Follow the affected instrument into plans, orders and fills before blaming slippage.
held / broker feed − held / model feed. Hold the lots fixed and change the valuation feed. This isolates a valuation difference between the two constructions.
Check instrument and expiry, point value, reciprocal quote conventions, currency basis, stale bars and roll treatment. A provider difference is not automatically bad data.
The implementation measures −(fill price − quote mid) × signed size, summed over fills and divided by the previous mark’s NAV.
This needs the quote associated with the order. It is a fill-to-mid measure; it does not establish a complete transaction-cost model or explain every execution effect.
Classified financing balance moves are bucketed into the same day and divided by the previous mark’s NAV. Deposits and withdrawals belong in capital flows instead.
Preserve timestamps and classifications. Funding, trading P&L and external capital must not be mixed just because all three move the account balance.
account − held / broker feed − spread − financing. This completes the identity; it is not an independently measured explanation.
A closed equation can coexist with stale inputs, missing records or an unsuitable valuation convention. Investigate the residual and data coverage rather than treating closure as proof of correctness.
03 · Published observation
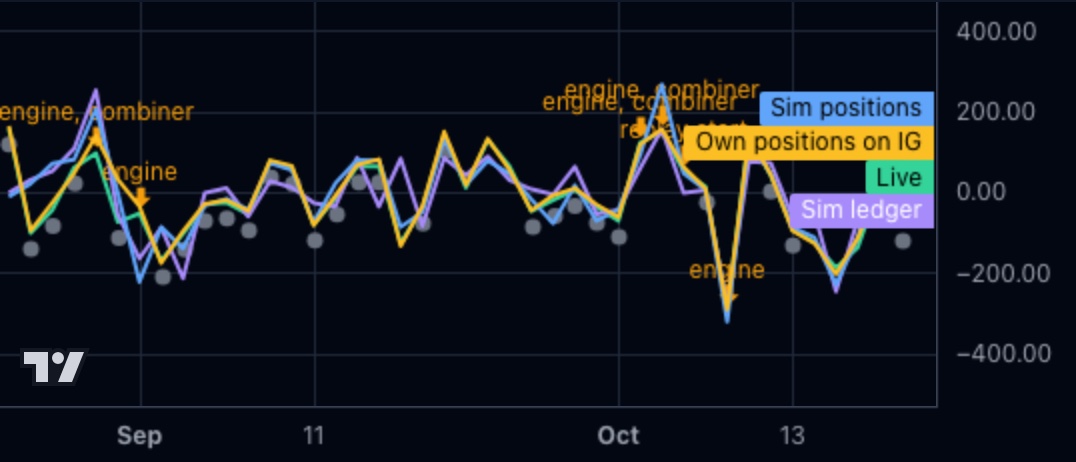
The chart compares the account, simulation ledger and reconstructed positions on one clock. Book changes and deployment dates give context for investigation; proximity to a marker does not establish that the change caused a difference.
These are demo-account observations, not live-capital results or evidence of investment performance. The chart is a historical capture. The bridge job recomputes a trailing window because the simulation ledger can restate; a later query need not reproduce an earlier screen unless the input vintage is retained.
04 · Make the explanation testable
The inspected implementation forward-fills prices and maps some unavailable calculations to zero. Arithmetic closure therefore cannot prove complete observations. Inspect bar counts, held instruments, snapshot age and the source interval alongside the result.
A ticker is insufficient identity. Check contract, multiplier, quote direction, price units, currency and NAV denominator. A correlation can look reassuring while the economic amount is wrong.
Retain model and configuration identity, served targets, planner events, broker lots, quotes, fills, balance moves and computation time. The bridge can then lead to a specific event rather than an anecdote.
The source separates pure calculation from fetching and persistence, and checks that the signed terms close before writing rows. Position reconciliation, order recovery and statement reconciliation remain separate controls. A daily P&L bridge cannot certify an unknown order outcome or replace a complete broker ledger.